
Greenhouse Photosynthesis Simulator: Light and CO2 Impact Calculator for Plants
The FvCB plant photosynthesis and gas exchange simulator will help you optimize the microclimate in your greenhouse or vertical farm for maximum yield.
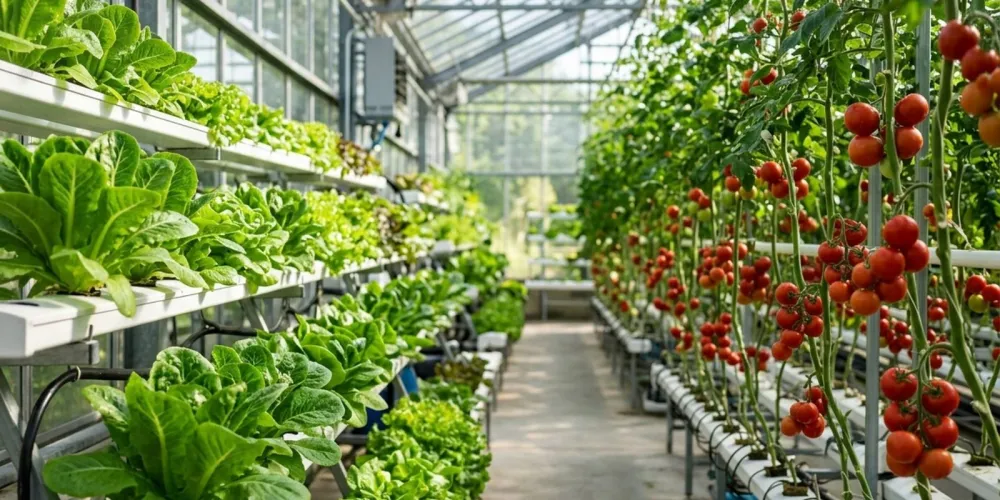
A plant photosynthesis simulator is an interactive digital model that allows you to virtually reproduce and test the FvCB gas exchange process to evaluate the efficiency of the microclimate in a greenhouse or vertical farm.
The simulator helps verify plant growth conditions and identify hidden climate-related issues that affect the efficiency of plant photosynthesis, which is the primary factor determining yield. The photosynthesis simulator is suitable for monitoring and assessing climate conditions in a greenhouse or vertical farm regardless of the type: substrate cultivation, soil-based, or aquaponics.
Photosynthesis Simulator for Greenhouses or Vertical Farms
It is not uncommon for situations to arise where everything is set up—fertilizers, temperature, humidity, and light—just like in the textbook, yet plants develop very slowly or stop growing altogether. To find the real problem, we recommend checking the climate using an online greenhouse photosynthesis simulator↗. The simulator accurately assesses which resource is currently in deficit, what a climate adjustment will actually affect, and whether there is enough light for the plants. The online calculator includes presets for popular crops: tomatoes, cucumbers, lettuce, and strawberries. It is based on the international FvCB mathematical model, where the rate of the process is always dictated by the most limited resource (Liebig's Law of the Minimum).
Plant Photosynthesis in a Greenhouse
To use the simulator effectively, it is important to understand how these figures relate. Plant photosynthesis in a greenhouse (net assimilation, A) is the rate at which a leaf captures carbon dioxide, minus what it consumes for its own needs (Ra). It is this final A parameter that turns into sugars and then into fruit or foliage mass. On the graphs, you will see the intersection points of the limits, which clearly indicate exactly what is hindering the plant's development. This information provides insight into what needs to be changed to achieve excellent results.
Influence of Lighting on Photosynthesis Rate
For plants, light is not measured in lux (which concerns human eye perception), but in PPFD—the photosynthetic photon flux density. The influence of lighting on the photosynthesis rate is reflected through the Aj limit (the rate limited by acceptor regeneration). The "A / Light" graph clearly demonstrates how carbon assimilation increases with light intensity. The graph shows a distinct "plateau point": the limit beyond which turning on additional grow lights is pointless, as the light is no longer assimilated without enhancing other climate parameters.
CO2 Enrichment in Greenhouses
When light is abundant but carbon dioxide is scarce, the leaf hits the Rubisco enzyme limit (Ac). Only at this point does CO2 enrichment in the greenhouse become fully effective. The "A / CO2" response graph will show whether the enrichment will pay off. For example, if the Ac curve is steep, adding extra CO2 will result in significant growth; if the graph is flat, the leaf is already saturated, and adding CO2 from a cylinder is useless.
Greenhouse Microclimate
A balanced greenhouse microclimate is not just about temperature optimization and balanced lighting, but also humidity control. The vapor pressure deficit (VPD) critically affects stomatal conductance (gs). A high VPD means the air is too dry: to prevent dehydration, the plant closes the microscopic pores on its leaves, completely blocking the intake of CO2 into the cells (Ci). In the photosynthesis simulator, humidity is calculated via the VPD calculation (humidity + temperature), which in turn controls the stomata.
How to use the simulator: Simply select a crop and adjust the 4 sliders: Light (PPFD), Leaf Temperature, CO2, and Air Humidity. The widget does not measure your specific climate conditions but is fully suitable for evaluating conditions based on your data.
We wish you good harvests!
Editorial team agronom.info
Materials are prepared by the portal's agronomists and editors. We use only trusted sources: Ukrainian agricultural universities, variety registries, open scientific publications.
Related articles
Watermelon Market 2026. The Best High-Profit Watermelon Varieties.
From scratch to its own brand: How DOLYA-2019 Farm is building a niche agribusiness on pumpkin seeds
Varieties or hybrids of vegetables: what is better to choose for a stable harvest
Not yet comments. Be the first!
Comments · 0